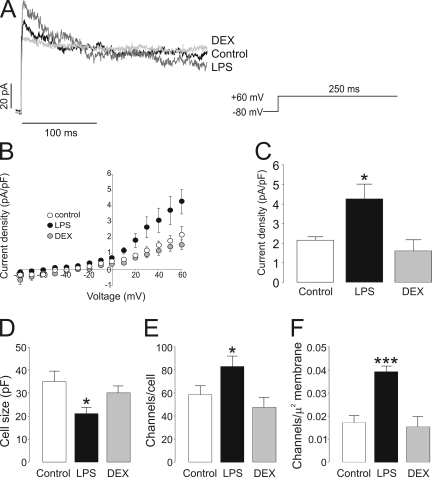
Figure 2.
Voltage-dependent K+ currents in Raw 264.7 macrophages. (A) Representative traces of delayed rectifier K+ currents in control, LPS-, and DEX-treated cells. Macrophages were treated with 100 ng/ml LPS and 1 µM DEX for 24 h. Cells were held at −80 mV, and currents were elicited by a depolarizing pulse to +60 mV (250-ms duration). Black trace, control; dark gray trace, LPS; light gray trace, DEX. (B) Current density (pA/pF) versus voltage relationship of K+ currents. Current density was calculated as a function of peak amplitude and the cell capacitance of each recorded cell. (C) Peak current density at +60 mV. (D) Cell capacitance (pF) from the same cell population from B. (E) Channel density was calculated from the conductance of Kv1.3 (13 pS) and Kv1.5 (8 pS) following the real-time PCR results in Fig. 4 and the Kv1.3/ Kv1.5 ratio shown in Fig. 8. (F) The results in E as a function of the plasma cell membrane surface. White (bar or circle), control; black (bar or circle), LPS; gray (bar or circle), DEX. *, P < 0.05; ***, P < 0.001 versus control; n > 10 cells per group (Student’s t test).

