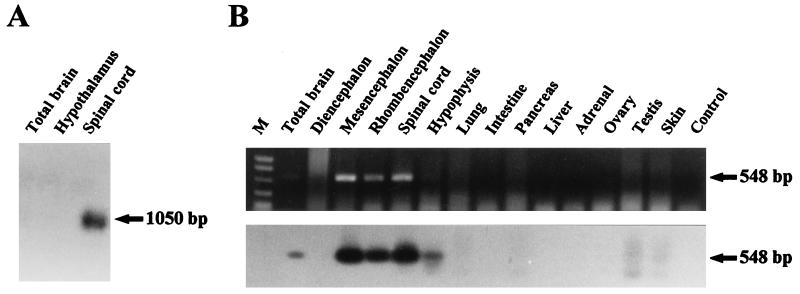
Figure 2.
Tissue distribution of frog prepro-UII mRNA. (A) Northern blot analysis of prepro-UII mRNA expression in the frog central nervous system. Total RNA (30 μg) was electrophoresed on a formaldehyde–agarose gel, transferred onto a nylon membrane and probed with the frog prepro-UII cDNA probe. (B) Analysis of prepro-UII mRNA distribution in various frog tissues by RT-PCR. Total RNA (5 μg) was reverse transcribed, amplified with prepro-UII specific primers, electrophoresed on an agarose gel and stained with ethidium bromide (Upper). The gel was then blotted and hybridized with an internal prepro-UII primer (Lower). The control lane contained no DNA. The sizes of the PCR products were evaluated by using a DNA mass ladder (M).

