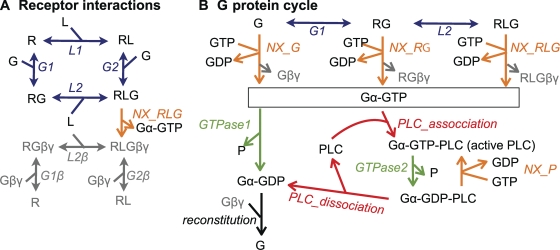
Figure 4.
Outline of the kinetic model. Model species are depicted with Roman letters, and reactions are in italics. For reversible reactions (double arrows), forward reactions are in the direction of association. Note that most species and some reactions occur in several places in the schema. (A) Binding of agonist ligand (L) and G protein heterotrimers (G) to the M1R (R) are implemented as an allosteric (ternary complex) model (blue), where ligand binding increases the affinity for G proteins and G protein binding increases the affinity for ligand. It is assumed that after NX, Gαq-GTP dissociates from the receptor, leaving behind Gβγ (gray). (B) G protein activation by NX (includes G protein dissociation; orange) and G protein deactivation by GTPase activity (green). Activated G proteins (Gα-GTP) deactivate slowly through their own GTPase activity (GTPase1) or much faster (GTPase2) when bound to PLC.

