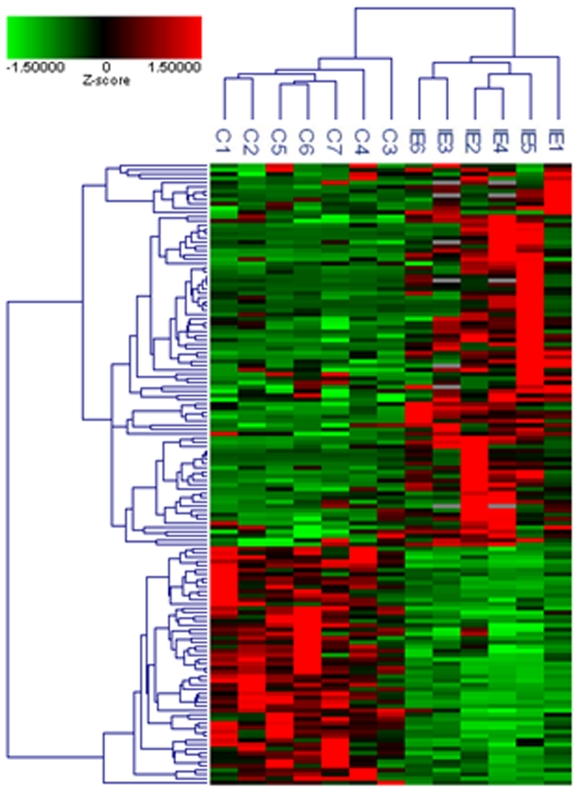
Figure 2. Hierarchical clustering analysis of transcriptional profiles of patients.
Only 18,083 genes, which were expressed with a P-value <0.01 and a CV >0.3 in at least one condition, were included in the analysis. Data were converted to z-score prior gene and sample classifications by unsupervised hierarchic clustering using the average linkage method and Cosine correlation coefficient as the distance metric. The hierarchical clustering of a selection of 146 genes differentially expressed by IE and controls is showed, with a colour gradient (Z-score) from green (down-regulation) to red (up-regulation).

