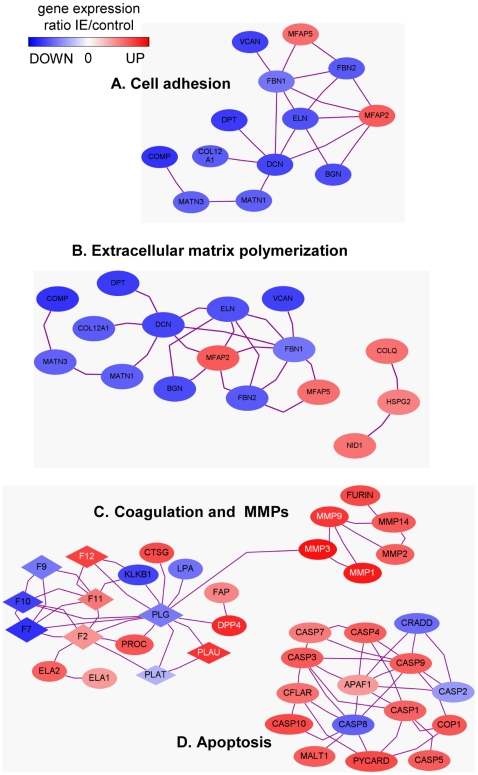
Figure 4. Network analysis in IE.
Differentially expressed genes in IE were subjected to GO annotation according cell adhesion (A), extracellular matrix polymerization (B), proteolysis (C) and caspase (D) networks. Only entities with binding partners are represented. Note that the proteolysis network included coagulation and MMP pathways that were connected whereas caspase pathway was isolated.

