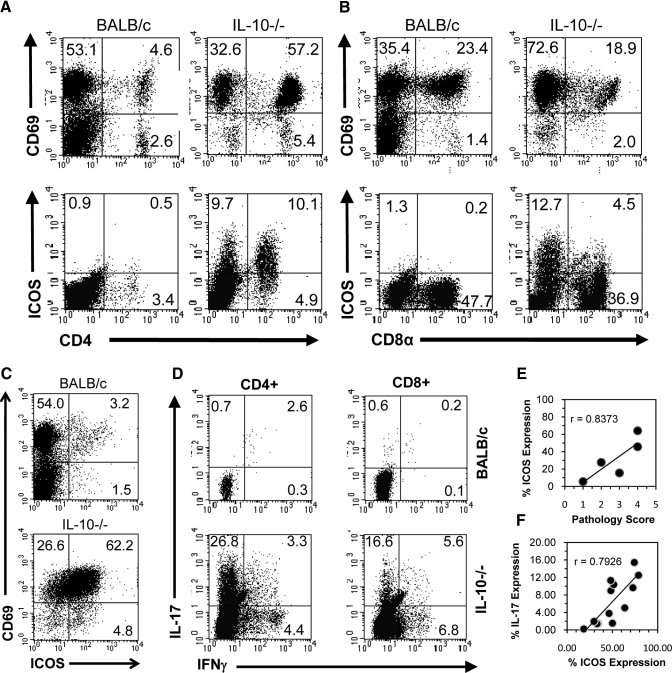
Figure 2.
Percent CD69 and ICOS expression. (A) Percent CD69 and ICOS expression between CD4+ and (B) CD8α+ cIELs in fresh isolates from BALB/c and IL-10−/− mice. (C) Note that ICOS is expressed on few cIELs in normal mice despite the expression of CD69 but is up-regulated in IL-10−/− mice. (D) IL-17+ and IFN-γ+ cells among CD4+ and CD8α+ cIELs in fresh isolates from normal BALB/c and IL-10−/− mice. Pearson correlation analysis of (E) ICOS expression versus pathology score and (F) IL-17 expression versus ICOS expression in cIELs from IL-10−/− mice with intestinal pathology. Data are representative of findings from five to 12 mice.

