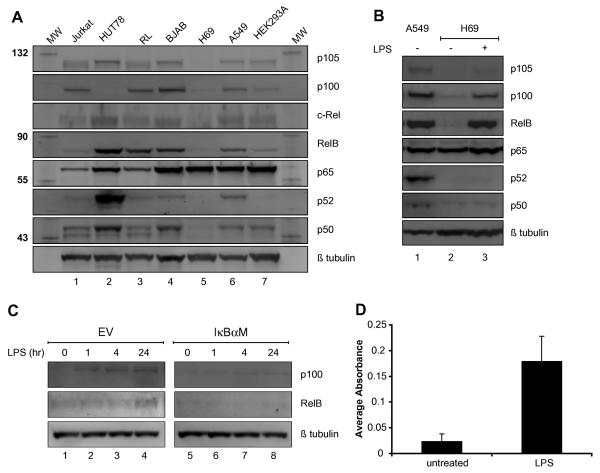
FIGURE 1. LPS induced RelB and p100 expression in H69.
(A) NF-κB expression profile of H69. Western blot of various NF-κB proteins in seven cell lines. Lane 1, Jurkat (T cell leukemia); Lane 2, HUT78 (cutaneous T cell); Lane 3, RL (diffuse B cell lymphoma); Lane 4, BJAB (Burkitt's lymphoma); Lane 5, H69 (small cell lung cancer); Lane 6, A549 (lung adenocarcinoma); Lane 7, HEK293A (kidney). The molecular weights (KD) of the marker proteins are indicated at left. (B) Induction of RelB and p100 following LPS stimulation. Western blot of whole cell lysates from A549 and H69 cells with or without LPS (1μg/ml) treatment for 24 hours. Lane 1, A549; Lane 2, H69; Lane 3, H69 with LPS. (C) IκBα-M transfection inhibited RelB and p100 induction following LPS treatment. Western blot analysis of whole cell lysates of H69 transfected with either the EV (empty control vector) or IκBaM with LPS (1μg/ml) for indicated time periods (0, 1, 4 and 24 hours). The membranes were probed with the indicated antiserum at right. (D) An increase in p65 DNA binding activity after LPS treatment. The DNA binding activity of p65 in nuclear extracts of H69 that were either untreated or treated with LPS (1 μg/ml) for 2 hours was assessed.

