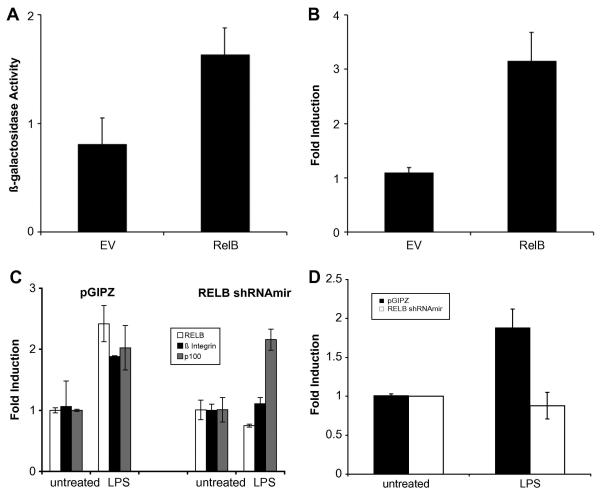
FIGURE 4. RelB expression induced attachment and ß1 integrin expression.
(A) Attachment assay of H69 transfected with either the control vector (EV) or RelB and plated in fibronectin-coated plates. (B) RTq-PCR analysis of EV and RelB transfected H69 cells. Twenty-four hours after transfection (in uncoated plates), cDNA was analyzed by RTq-PCR. The fold induction represents the amount of indicated β1 integrin induction over the H69 without transfection. (C) RTq-PCR analysis of control (pGIPZ) and RELB shRNAmir tranfected H69 cells for RELB, ß1 integrin, and p100 transcripts. Total RNA from transiently transfected cells treated with LPS (1 μg/ml) overnight was used to generate cDNA for RTq-PCR analysis. (D) The relative amount of HIF1-a induction was assessed by RT-qPCR as described in the Materials and Methods section.

