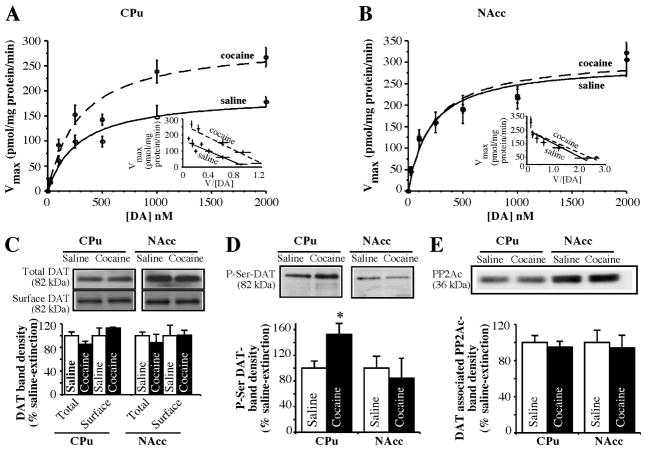
Figure 2. DA uptake kinetics, DAT-sub-cellular distribution, DAT Ser-phosphorylation and DAT-PP2 interactions in synaptosomes from CPU and NAc 3 following 3 weeks of extinction after chronic cocaine self-administration.
DA uptake was measured over a range of 0.01–2.0 μM DA using CPu (A) or NAc (B) synaptosomes as described in “Materials and Methods”. Nonlinear curve fits of data for uptake used the generalized Michaelis-Menten equation. Insets show Eadie-Hofstee plots of transformation of the data. Measurements of surface DAT (C), DAT-Ser phosphorylation (D) and DAT-PP2Ac association (E) were performed as described in “Materials and Methods”. Representative immunoblots are shown in C, D and E. Averaged protein band densities from three separate experiments are shown under the immunoblots (each experiment used CPu or NAcc tissue pooled from 3 or 4 rats). Data are presented as mean ± S.E.M percent change from the saline group. *p <0.02 compared with saline (CPu) by a two-tailed Student’s t-test.

