
Fig 3.
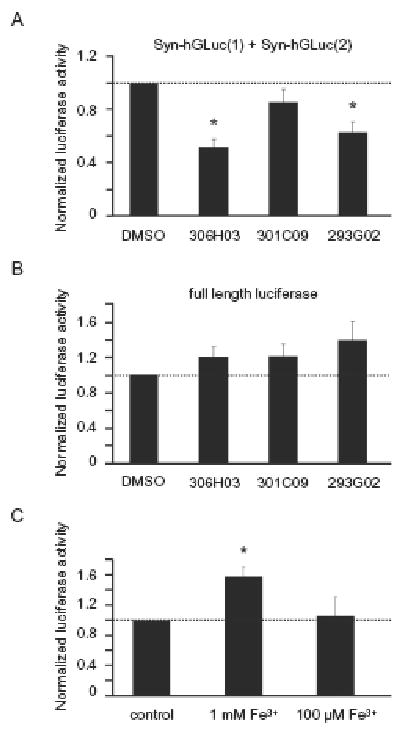
A) Quantitative analysis of the luciferase activity of cells co-transfected Syn-hGLuc(1) and Syn-hGLuc(2) constructs showed a 48.7 % decrease of oligomers in case of 306H03 treated cells (p<0.005) and 37.1 % decrease in case of 293G02 treated cells (p<0.01, both n=5), normalized to control cells. B) In contrast, no reduction of luciferase activity was detected in cells transfected with full length luciferase. C) Cells co-transfected with the Syn-hGLuc proteins and treated with 1 mM FeCl3 showed a 58.6 % (p<0.05) increase of luciferase activity. In all graphs, the mean and standard error is shown.