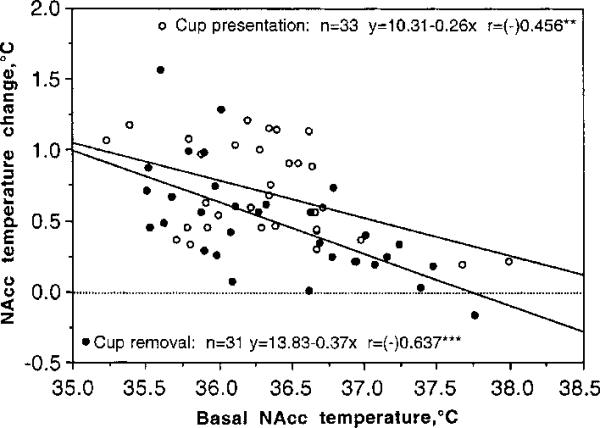
Fig. 2.

The relationships between basal NAcc temperatures and their changes induced by cup presentation and its removal. For this analysis, all tests (n) with Coke presentation and removal (two from each session) were combined, and peak increases induced by both stimuli were represented vs. basal temperatures. In each case, amplitude of temperature elevation was negatively dependent on basal temperature. Both regression lines intersect with the line of no effect (=0, hatched) at higher brain temperature (~37.75 and 38.80°C for cup removal and presentation, respectively). r is a coefficient of correlation, which is highly significant for both tests.
