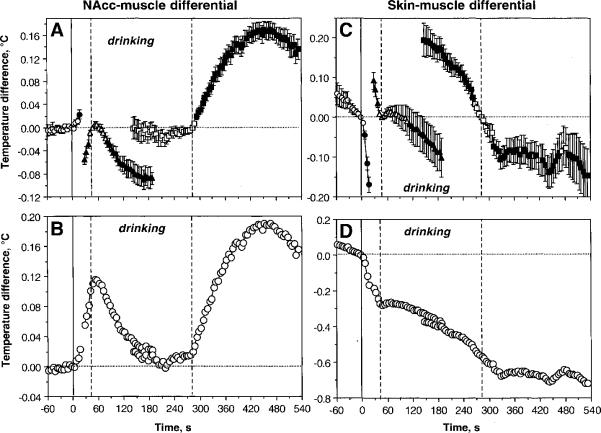
Fig. 4.
Mean changes in NAcc-muscle (A and B) and skin-muscle (C and D) temperature differentials during motivated drinking behavior. The changes are shown in two ways: with respect to the reference point of the behavioral event (Coke-containing cup presentation, initiation of drinking, and its end) set as zero (A and C) and with respect to the starting point (cup presentation) (B and D). Three vertical lines show, respectively, the moments of Coke-containing cup presentation (solid line=0 s), initiation of drinking (first hatched line), and its end (second hatched line). Similar to data shown in Fig. 3, statistical evaluation was done separately for each of three events, with plus (following) and minus (preceding) time comparisons. Filled symbols show values statistically significant from reference points. F values for cup presentation are: NAcc-muscle differential F32,164=5.88; skin-muscle differential = 57.40 (both p<0.001). F values for initiation of drinking: (1) preceding drinking onset: NAcc-muscle differential F32,164=23.99, skin-muscle differential =16.18 (both p<0.001); (2) following drinking onset: NAcc-muscle differential F32,956=22.46; skin-muscle differential 4.67 (both p<0.001). F values for changes following the end of drinking: (1) preceding end of drinking: NAcc-muscle differential =F32,956=0.59, p=0.59; skin-muscle differential =15.31 (p<0.001); (2) following drinking offset: NAcc-muscle differential F32,1022=57.13 (p<0.001), skin-muscle differential =2.86 (p<0.01). While most changes are significant, note quantitative differences in F values that show the strength of the effect.

