
Fig. 5.
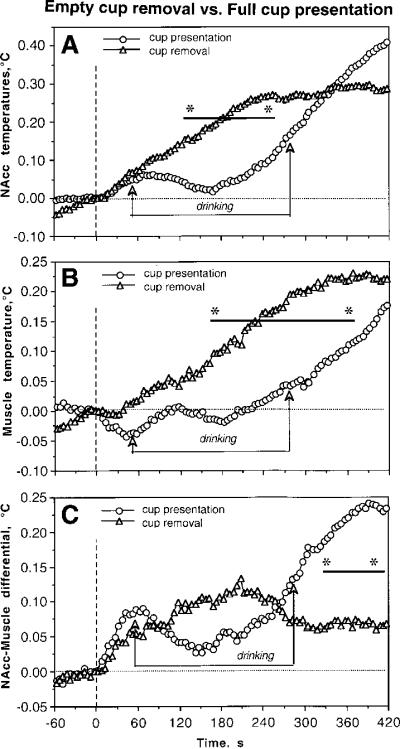
Differences in high-speed temperature dynamics in the NAcc (A), temporal muscle (B), and NAcc-muscle temperature differentials (C) associated with presentation of Coke-filled cup and subsequent removal of the empty cup. Vertical hatched line at time=0 s shows the moments of cup presentation and removal. Two lines with arrows show the duration of drinking after full cup presentation. Bold lines with asterisks show intervals where between-group differences in each parameter were significant (p<0.05, Student's t-test).