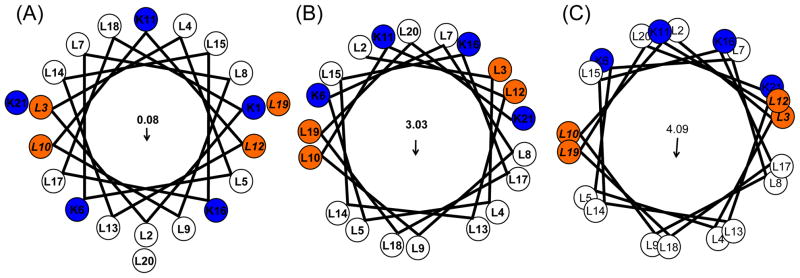
Figure 1.
Helical wheel plots of KL4 with varying (ϕ, ψ torsion angles. (A) Wheeleratedgen assuming a canonical α-helix (ϕ, ψ = −63°, −42°); (B) using the average torsion angles determined in POPC:POPG vesicles (ϕ, ψ = −105°, −30°); and (C) using the average torsion angles observed in DPPC/POPG vesicles (ϕ, ψ = −63°, −81°). Arrows indicate the net hydrophobic moments resulting from the distribution of charged lysine sidechains on the helix surface. The first lysine is not shown in (B) and (C) as NMR data indicate the N-terminus is less structured relative to the rest of the helix.

