
Fig. 3.
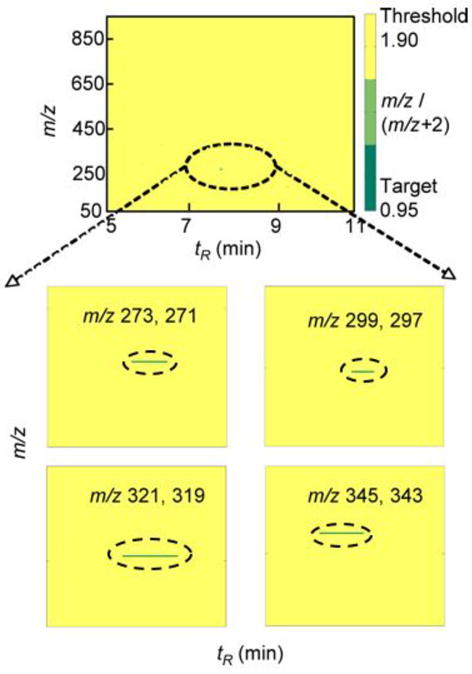
DoGEX results of substrate search with liver extract fraction 2 and human P450 4F11. The green regions indicate that the ratio of chromatographic peaks (m/z and m/z+2) is close to 0.95 (the lower limit of the target ratio) and the yellow area shows all the values beyond the threshold value. Positive values (approaching the target of 0.95, and circled with broken ovals) were found for four different pairs of peaks, subsequently identified, in the tR 7–9 min region and are shown in the expanded sections.