Figure 2.
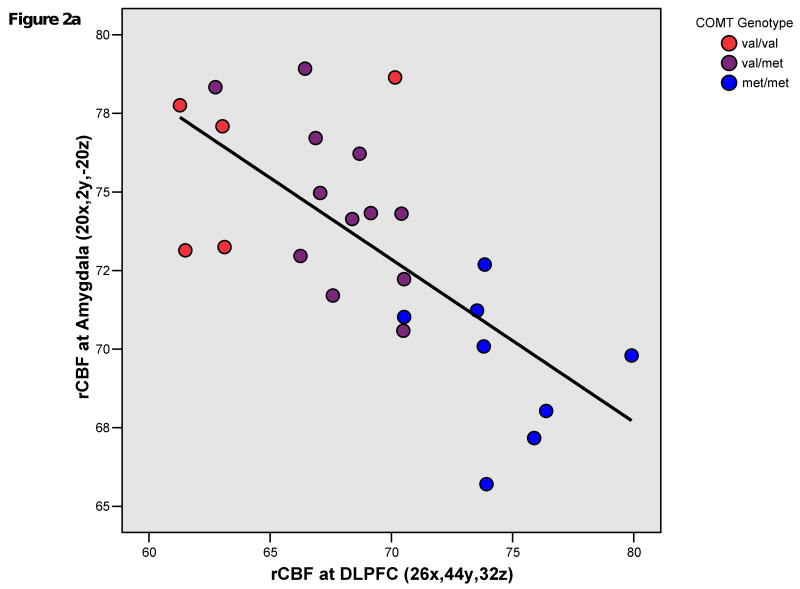
Figure 2a. Plot of mean resting regional cerebral blood flow (rCBF) in right dorsolateral prefrontal cortex (DLPFC) and amygdala at the representative peak voxels of clusters showing significant correlation with COMT genotype in patients with schizophrenia. Pearson's r = -0.701; p<0.001; R Sq Linear = 0.491.
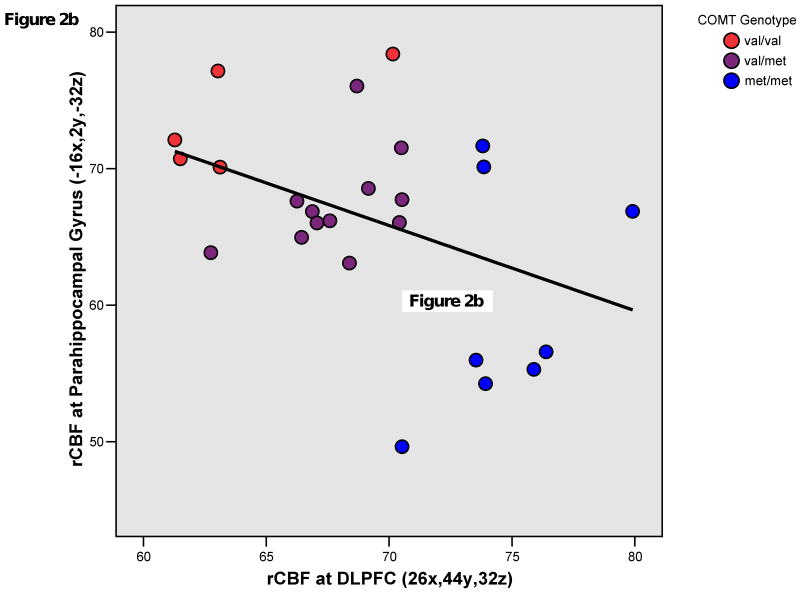
Figure 2b. Plot of mean resting regional cerebral blood flow (rCBF) in right dorsolateral prefrontal cortex (DLPFC) and left parahippocampal gyrus at the representative peak voxels of clusters showing significant correlation with COMT genotype in patients with schizophrenia. Pearson's r = -0.418; p = 0.038; R Sq Linear = 0.175.


