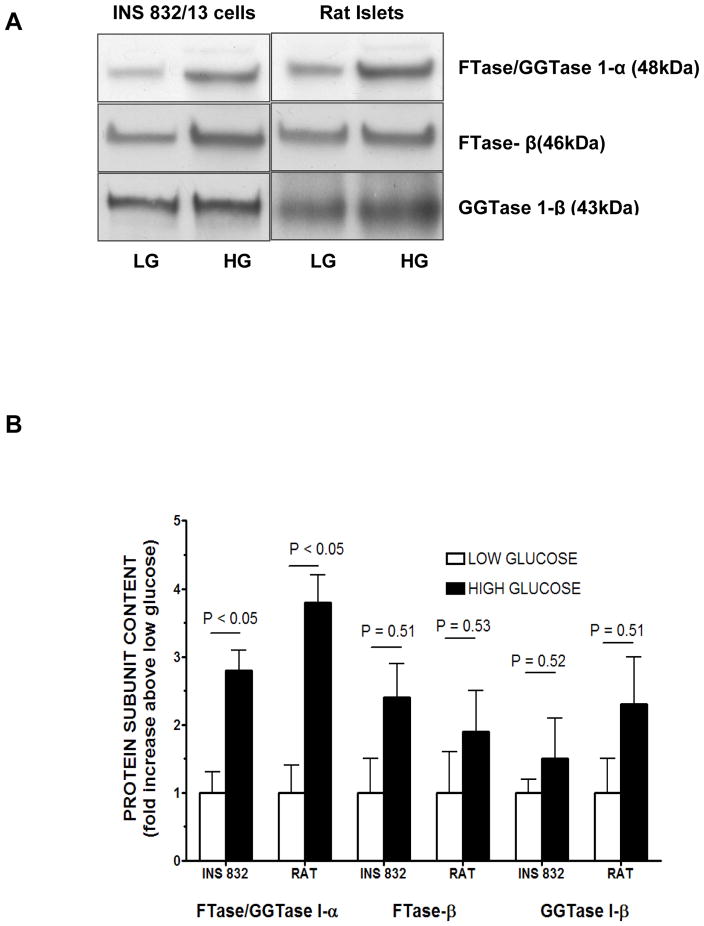
Figure 2. Changes in the protein contents of FTase and GGTase subunits in INS 832/13 cells and isolated rat pancreatic islets exposed to basal or stimulatory glucose.
Panel A: INS-832/13 cells and isolated rat pancreatic islets were cultured overnight in low glucose-low serum media. Cells were further incubated in presence of either low glucose [2.5 mM; LG] or high glucose [20 mM; HG] for 45 min. Homogenate proteins were separated by SDS-PAGE, transferred to a membrane and probed with corresponding antibodies for detection of FTase/GGTase 1- α, FTase β and GGTase 1-β subunits. A representative blot from two studies is shown here. Panel B: Relative intensities of protein bands from experiments described under Panel A are quanitiated by densitometry and plotted. Pooled data from two separate studies are given.

