
Figure 5. Inactivation of ERK1/2 and mTOR pathway in ephrin stimulated neurons.
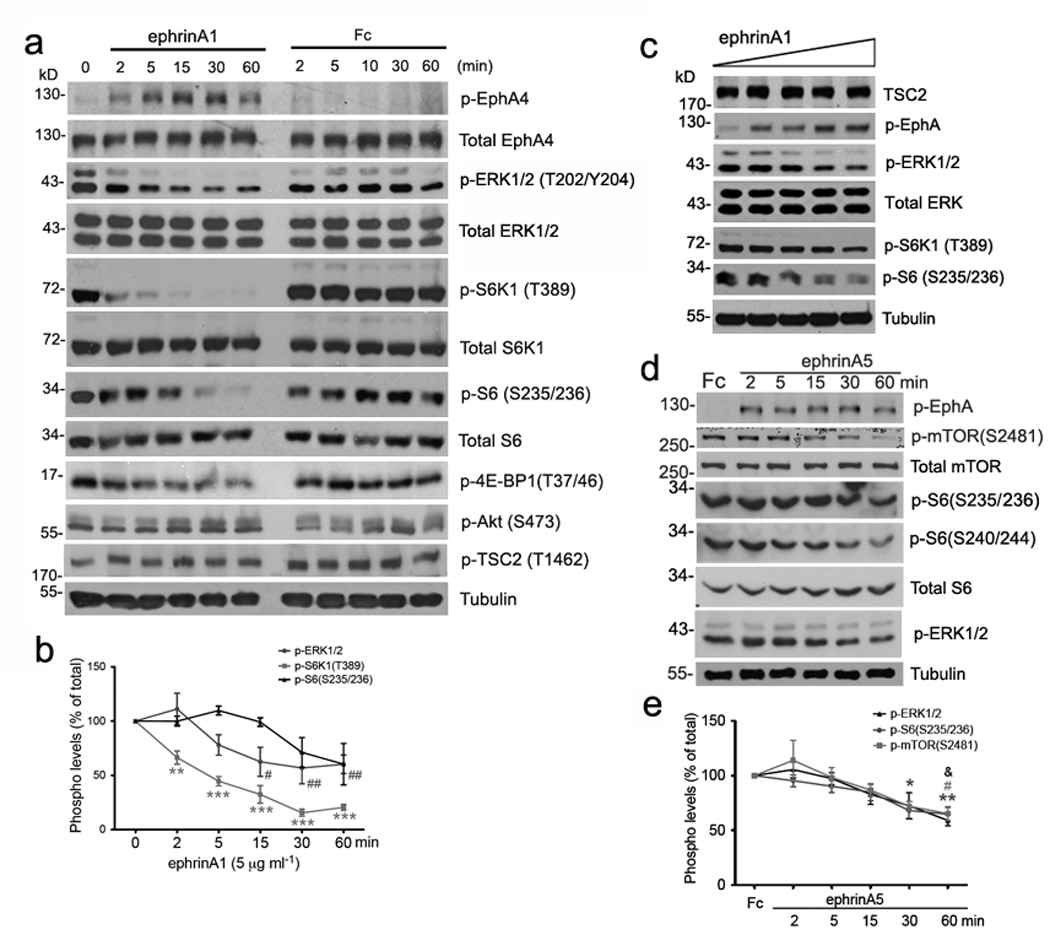
(a) Tsc2+/+ cortical neurons maintained in culture for 7 days were stimulated with either pre-clustered ephrin-A1-Fc or Fc as the control. Western analyses of neurons stimulated with 5 µg/ml proteins for the indicated minutes. Total EphA4, ERK1/2, S6K1, S6 and tubulin are used as loading controls. (b) Quantitative analysis of phosphor-protein levels over the stimulation course as in (a). Significant reduction in phosphorylation levels was found by t-test at each time point versus 0 min (** P < 0.01 comparing phospho-S6K1 (Thr389) at 2 min and *** P < 0.001 at 5, 15, 30 or 60 min; # P < 0.05 comparing phospho-ERK1/2 at 15 min and ## P < 0.01 at 30 or 60 min). (c) Western analyses of cortical neurons stimulated for 30 minutes with ephrin-A1 at ascending concentrations (0.1, 1, 5, 10 and 20 µg/ml). Total ERK1/2 and tubulin are used as loading controls. (d) Western analyses of Tsc2+/+ cortical neurons grown in culture for 12 days and stimulated with either pre-clustered Fc (as the control) for 60 minutes or ephrin-A5-Fc for the indicated minutes. Total mTOR, S6 and tubulin are used as loading controls. (e) Quantification of the phosphorylation levels of mTOR, S6 and ERK1/2 in Fc versus ephrinA5-Fc (5 ⎧g /ml) stimulations. Significant reduction in phosphorylation levels was found by t-test comparing ephrin-A5 at each time point versus Fc stimulation (* P < 0.05 comparing phospho-S6 at 30 min and ** P < 0.01 at 60 min; # P < 0.05 comparing phospho-mTOR at 60min; & P < 0.05 phospho-ERK1/2 at 60min versus Fc). Full-length gels are presented in Supplementary Figure S13.