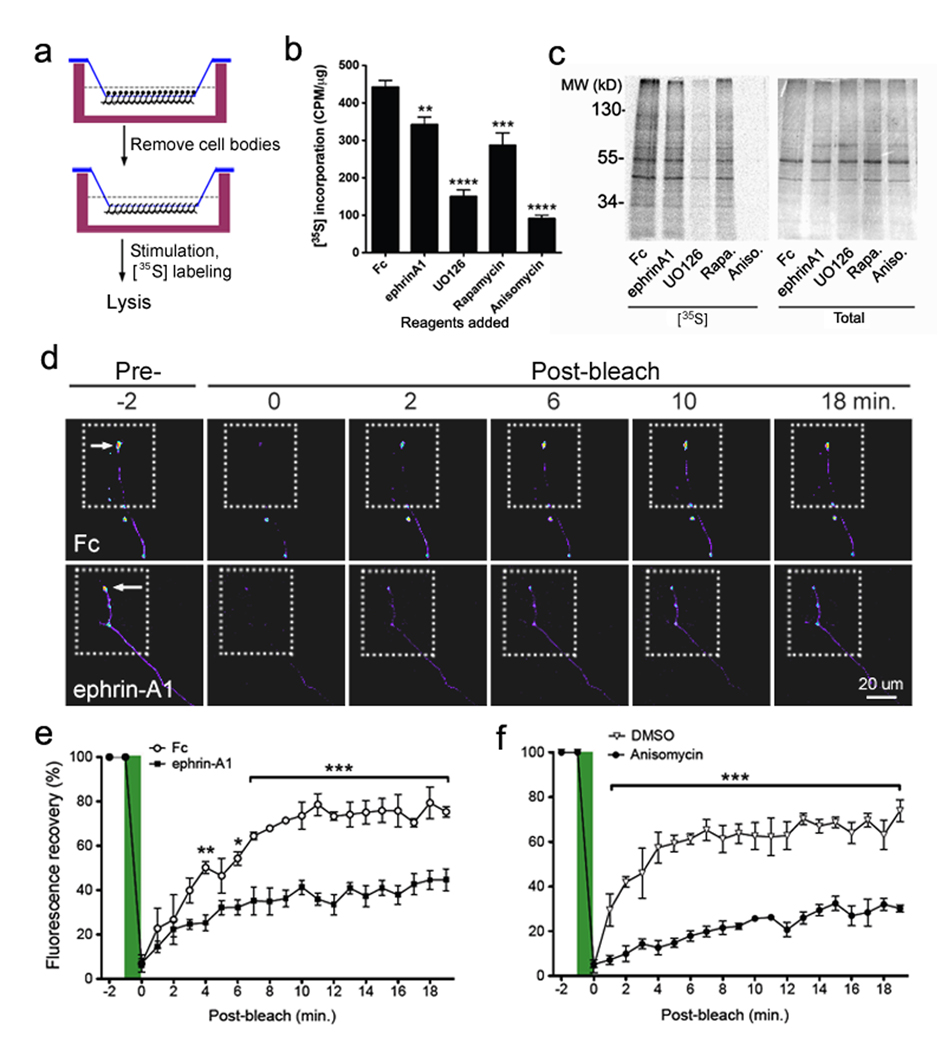
Figure 6. Ephrin inhibits axonal protein synthesis and the local translation of a beta-actin reporter in growth cones.
(a) Schematic representation of the experimental design using [35S]-labeling and collection of axon-enriched lysates using Boyden transwells (see Material and Methods). (b) Cell bodies of rat hippocampal neurons grown in Boyden transwells were removed, and the neurites in the lower chamber were stimulated immediately with preclustered Fc, ephrin-A1-Fc (5 ⎧g/ml), UO126 (20 µM), rapamycin (20 nM) or anisomycin (40 ⎧M) for 30 minutes. Quantification of the [35S] incorporation (CPM/⎧g) in TCA-precipitated lysate shows that ephrin-A1 inhibits de novo protein synthesis as compared to Fc, but to a lower extent than UO126, rapamycin, or anisomycin. Results represent mean ± SEM from 3 independent experiments (**P < 0.01, ***P < 0.001, and ****P < 0.0001 by t-tests). (c) A representative [35S] autoradiograph showing reduction in the amount of newly synthesized proteins from axons treated with ephrin-A1, UO126, rapamycin or anisomycin compared with control Fc-treated axons. (d) Hippocampal neurons were transfected with dGFPmyr-bACT-3’UTR and frames with dashed lines represent region of bleaching. Representative images show the fluorescence recovery after photobleaching in terminal axons transfected neurons over a period of 20min, in the presence of ephrin-A1-Fc or Fc as control. Arrows indicate axonal growth cones. Scale bar, 20 ⎧m. (e) Quantification of GFP fluorescence intensity pre- and post-bleaching in ephrin-A1-Fc versus Fc treatments. Data at each time point represent average % of pre-bleach levels ± s.e.m. (n = 3 for Fc and n = 6 for ephrin-A1-Fc). Significant difference in signal recovery was assessed by two-way ANOVA when comparing ephrinA1 versus Fc treatments at each time point post-bleaching (*P< 0.05 at 6 min; **P< 0.01 at 4 min; and ***P< 0.001 at 7~19 min). (f) Quantification of GFP signal recovery in anisomycin versus DMSO treatments. *** P < 0.001 by two-way ANOVA.

