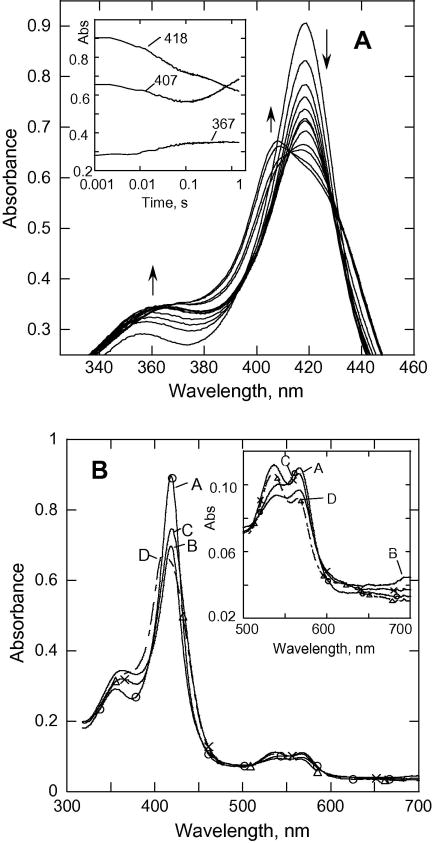
Fig. 2.
(A). Rapid-scan absorbance data for the reaction of CYP153A6 (7.2 μM) with mCPBA at pH8.0, 3.4 °C. To show spectral changes more clearly, the peak of the Soret band has been expanded. Inset, data recorded at indicated wavelengths. (B) SVD analysis of the rapid scan recorded for the reaction in (A). Model used was A→B→C→D with k1 = 34 s-1, k2 = 3 s-1, k3 = 1.4 s-1. A (–○–○–); (– – –); C (–x–x–); D (--△--△-).

