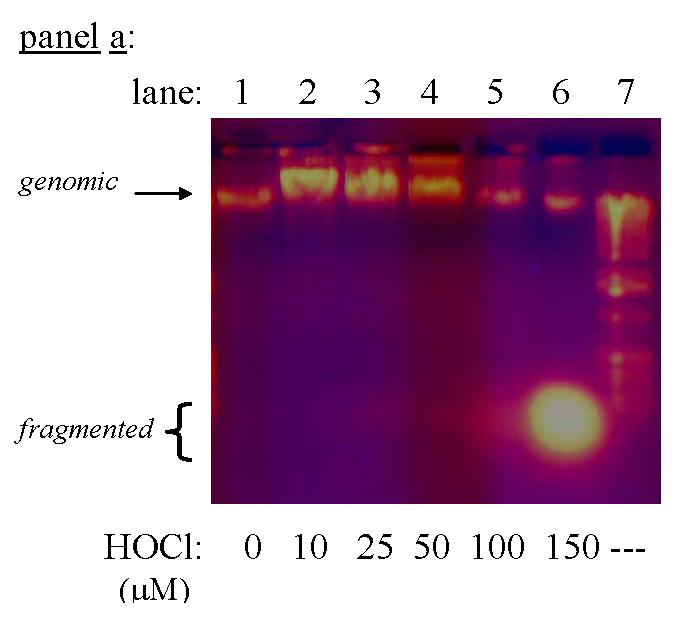
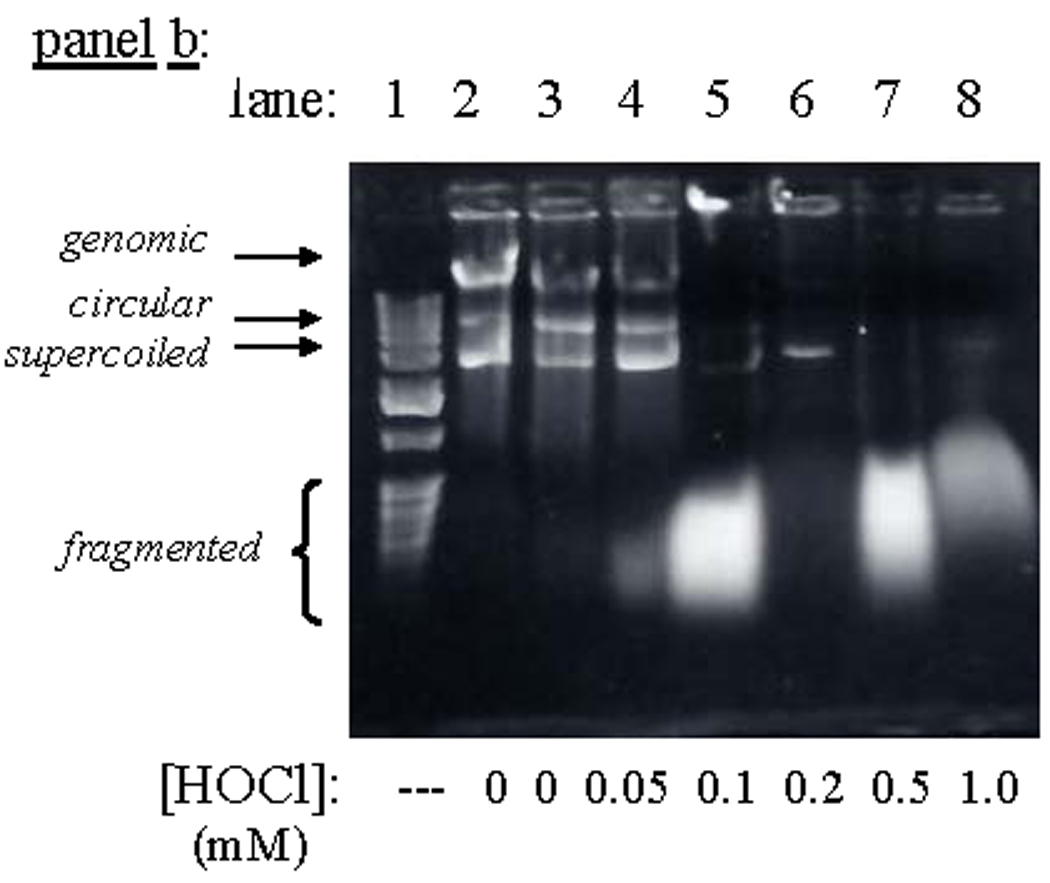
Fig. 5.


Degradation of DNA in NovaBlue cells following exposure to HOCl. Conditions: E. coli suspended at the indicated cell densities in 50 mM phosphate, pH 7.4, incubated 15 min at ambient temperature, then oxidant quenched with excess Na2S2O3, and the DNA isolated and run on 0.8% agarose. Panel a: 2.4×10⁸ plasmid-free cells/mL, for which LD90 ~38 µM (color photograph) ; panel b: 5×10⁷ pETBlue transformed cells/mL, for which LD90 ~8 µM.
