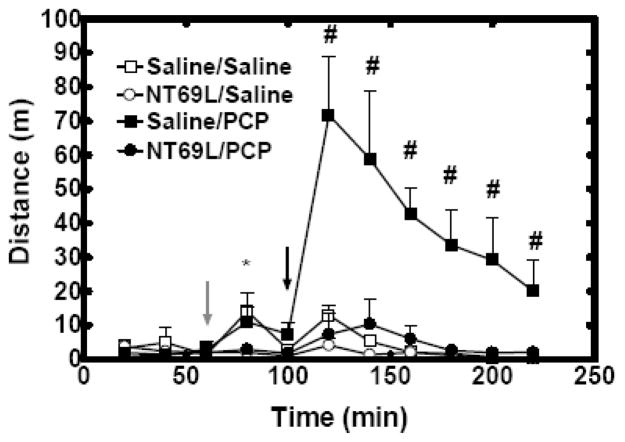
Figure 2.
NT69L blocked PCP-induced hyperactivity. The data are shown as the mean of total travel distance measured every 20 min (±S.E.M.). (N=5 for Saline/PCP group, Saline/Saline group and NT69L/Saline group, N=6 for NT69L/PCP group). *, P<0.05 NT69L treated groups versus Saline treated groups. #, P<0.05 versus Saline/Saline, NT69L/Saline and NT69L/PCP groups. Gray arrow indicates when rats received either saline or NT69L injection. Black arrow indicates when rats received either saline or PCP injection.

