
Figure 3.
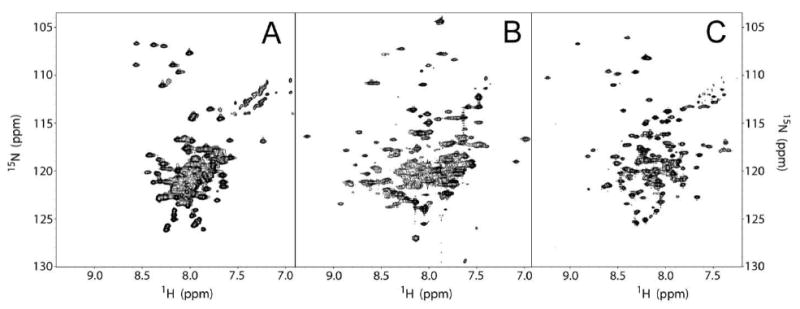
Panels A, B, and C are 1H-15N TROSY-HSQC spectra of wild type C99, DAGK, and KCNE1, respectively. Each spectrum was processed without a window function. Note that in each spectrum there is significant resonance overlap that would hinder PRE measurements. The C99, DAGK, and KCNE1 spectra were recorded at 800, 800, and 600 MHz (1H), respectively.