
Figure 4.
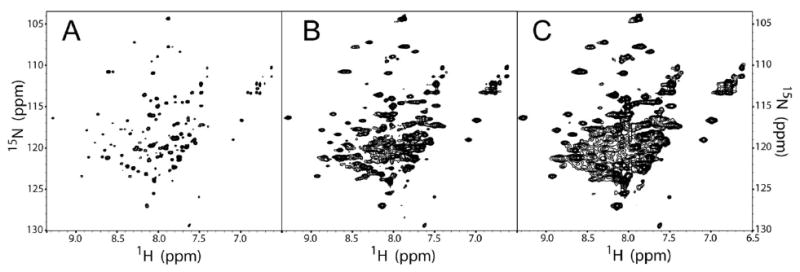
1H-15N TROSY HSQC DAGK data illustrating the wide range of spectral effects that can be achieved by the application of window functions. Panel A shows a DAGK spectrum processed using a strong resolution enhancing Lorentzian-to-Gaussian transformation (GM). Panel B shows the same data but processed with slight resolution enhancement by a π/3 shifted sine bell function. Panel C shows data that was processed with no resolution enhancement by a squared sine bell shifted by π/2, a function equivalent to a squared cosine bell.