
Figure 5.
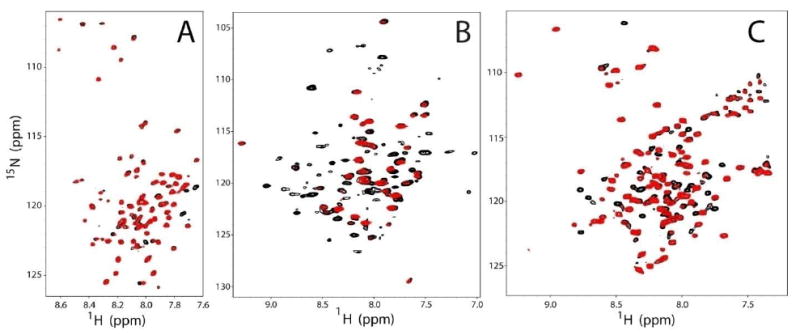
Representative PRE data. Panels A, B, and C are representative PRE data sets from MTSL-labeled T729C C99, MTSL-labeled I82C DAGK, and MTSL-labeled S64C KCNE1, respectively. The spectra are overlaid with the reduced (diamagnetic) spectrum in black and the oxidized (paramagnetic) spectrum in red. Each data set was modified with a Lorentzian-to-Gaussian window function in both dimensions in order to demonstrate the utility of resolution enhancement.