
Figure 7.
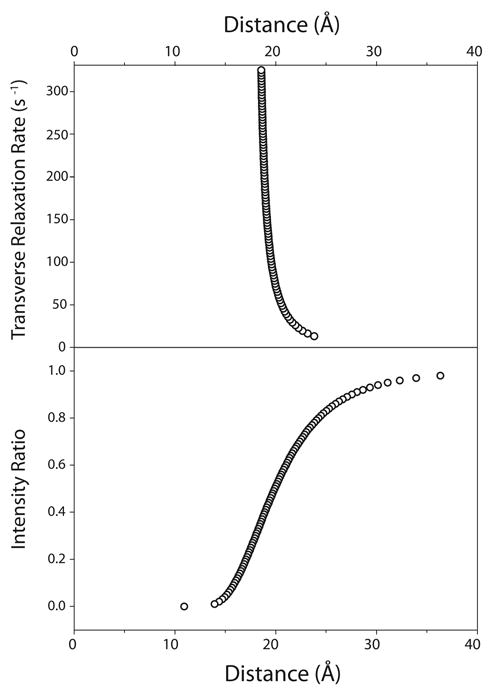
Simulated dependencies of diamagnetic relaxation rates (R2) and intensity ratios (Iox/Ired) on distance. These panels show how a given experimental R2 or Iox/Ired value affects the corresponding distance assuming all other parameters are held constant. The top panel shows the relationship between transverse relaxation (R2) and distance. The bottom panel relates the resonance intensity ratio (Iox/Ired) to distance. The parameters used to generate these plots mimics typical parameters used for DAGK PRE measurements (e.g. a τc of 35 ns and τINEPT of 9.6 ms). The top panel assumed a constant intensity ratio of 0.5, while the bottom panel assumed an R2 value of 74 s-1.