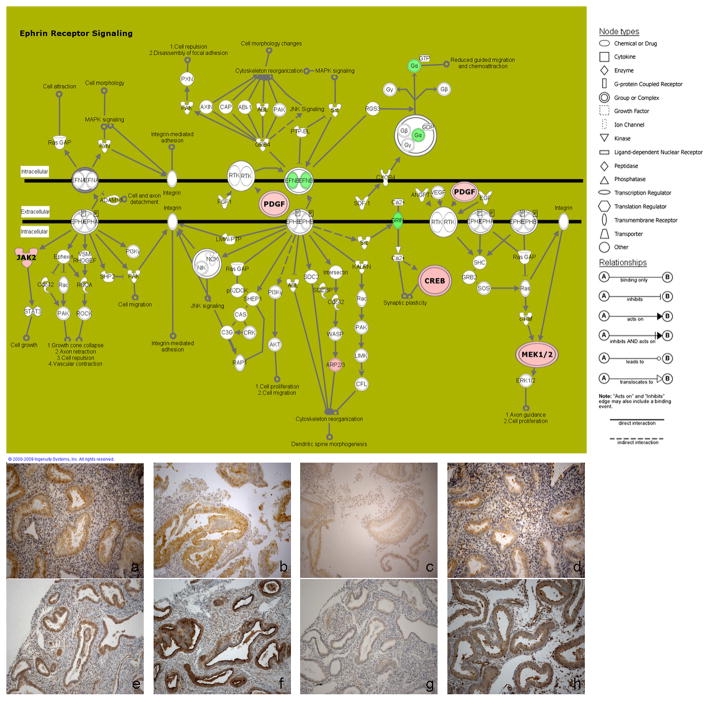
Figure 1.
Top: Ephrin receptor signaling pathway with downregulated (in green) and upregulated (in red) genes in the endometrium from the pregnant patient. Node (gene) and line (gene relationships) symbols are described in the right part of the figure.
Bottom: Immunohistochemistry of the endometrial biopsy from the pregnant patient for JAK2 (a), PDGFA (b), CREB3 (c) and MEK1 (d) and from control non-pregnant patients for JAK2 (e), PDGFA (f), CREB3 (g) and MEK1 (h) showed cytoplasmic staining, predominantly in the glandular epithelium.

