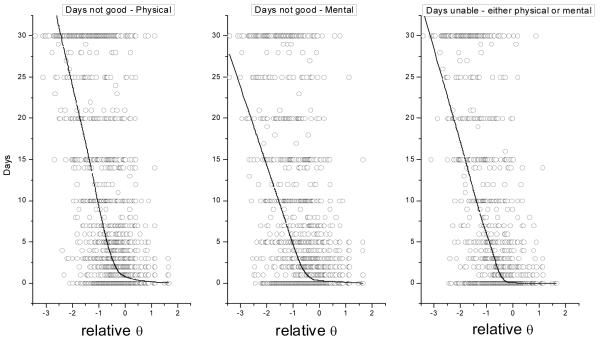
Figure A2–3.
Scatterplots of “healthy days” questions versus Relative θ. These questions ask respondents how many days out of the past 30 their physical health, mental health was “not good.” The third question (H-Days all) asks out of the past 30 days how many days did poor physical or mental health keep the respondent from doing usual activities such as self-care, work, or recreation. The heavy lines are LOWESS smoothed lines as in Figure 2. Each scatterplot displays 3844 data points (gray circles).

