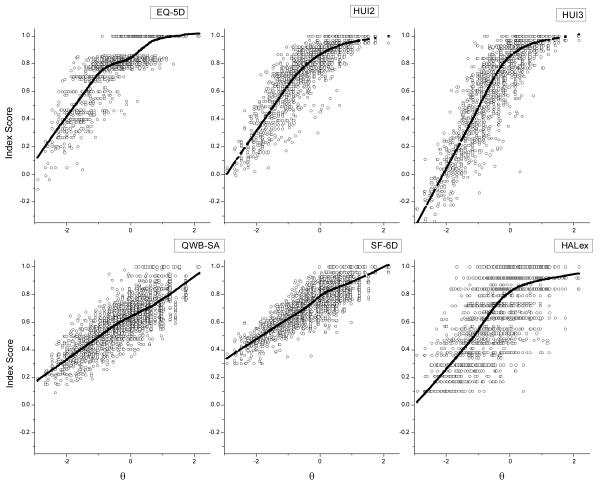
Figure 2.
The 6 panels plot index scores v. θ for the 5 main health-related quality-of-life (HRQoL) indexes and the Health Activities Limitations Index (HALex). Horizontal and vertical banding for the 3844 data points in each plot represents discrete attainable levels for the index or derived θs. The heavy lines are points fit using Minitab®15.1 statistical software and the locally weighted scatterplot smoothing (LOWESS) option, a variant of kernel smoothing in the vertical dimension of scatterplots.[16] The LOWESS lines demonstrate nonlinearity of the relation between the index scales and θ.

