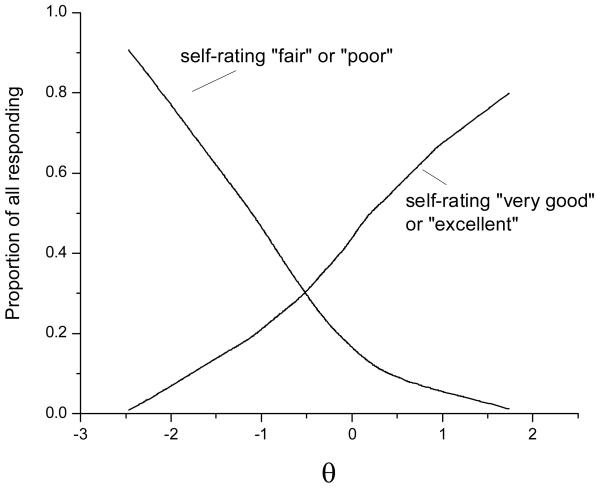
Figure 4.
Smoothed proportions of National Health Measurement Study (NHMS) respondents self-rating health as “fair” or “poor” and as “very good” or “excellent” as a function of θ. The proportions of responses in these categories were calculated for a window of 50 data points moving from θ=–2.5 through θ=2 for the 3844 observations. The resulting proportions were then Locally Weighted Scatterplot Smoothing (LOWESS)- smoothed as described for Figure 2 and the result shown here.

