
Fig. 1.
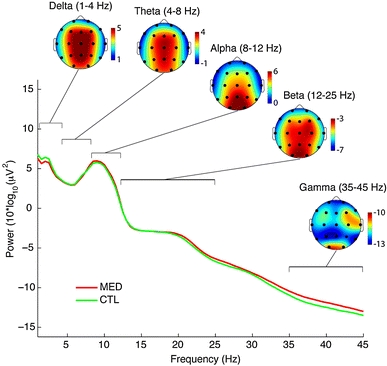
The power spectrum for electrode Cz is displayed for both meditation and control states. Grand average scalp maps across states are displayed for each of the major frequency bands so as to indicate scalp topography of the various frequencies
Official websites use .gov
A
.gov website belongs to an official
government organization in the United States.
Secure .gov websites use HTTPS
A lock (
) or https:// means you've safely
connected to the .gov website. Share sensitive
information only on official, secure websites.
The power spectrum for electrode Cz is displayed for both meditation and control states. Grand average scalp maps across states are displayed for each of the major frequency bands so as to indicate scalp topography of the various frequencies