
Fig. 3.
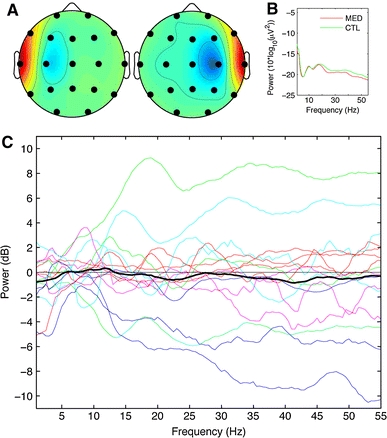
Panel A indicates the grand average scalp map for the left and right muscle-independent components, respectively. Panel B presents the grand average power spectra for the muscle components for both meditation and control states. In panel C, the thin, colored lines indicate difference in power across the range of frequencies for the muscle components; meditation minus control period for all subjects (when more than one component was present for a given subject, the power spectrum for these components was averaged). The bold, black trace indicates the grand average spectrum difference for the contrast meditation minus control such that segments above 0 indicate greater average component activity during meditation and below 0 indicate greater average component activity during control period