
Fig. 4.
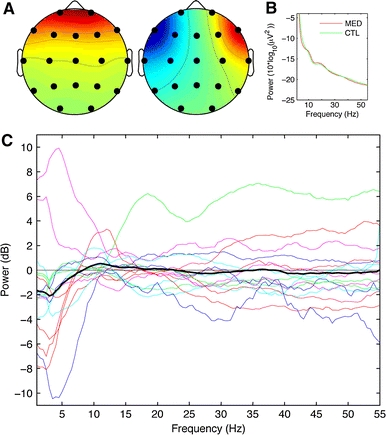
Panel A indicates the grand average scalp map for vertical and horizontal eye-movement independent components, respectively. Panel B presents the grand average power spectra for the eye-movement components for both meditation and control states. In panel C, the thin, colored lines indicate the difference in power across the range of frequencies for the eye-movement components between meditation and control period for all subjects. The bold, black trace indicates the grand average spectrum difference for the contrast meditation minus control such that segments above 0 indicate greater average component activity during meditation and below 0 indicate greater average component activity during control period