
Fig. 5.
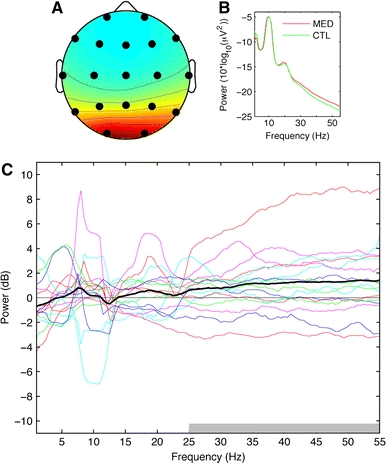
Panel A indicates the grand average scalp map for the occipital alpha independent components. Panel B presents the grand average power spectra of the occipital alpha components in meditation and control states. In panel C, the thin, colored lines indicate the difference in power across the range of frequencies for the occipital alpha components between meditation and control periods for all subjects. The bold, black trace indicates the grand average spectrum difference for the contrast meditation minus control. The gray bar at the bottom of the figure indicates frequencies over which bootstrap statistics with FDR correction for multiple comparisons indicated statistically significant greater values in meditation than control state (25–55 Hz)