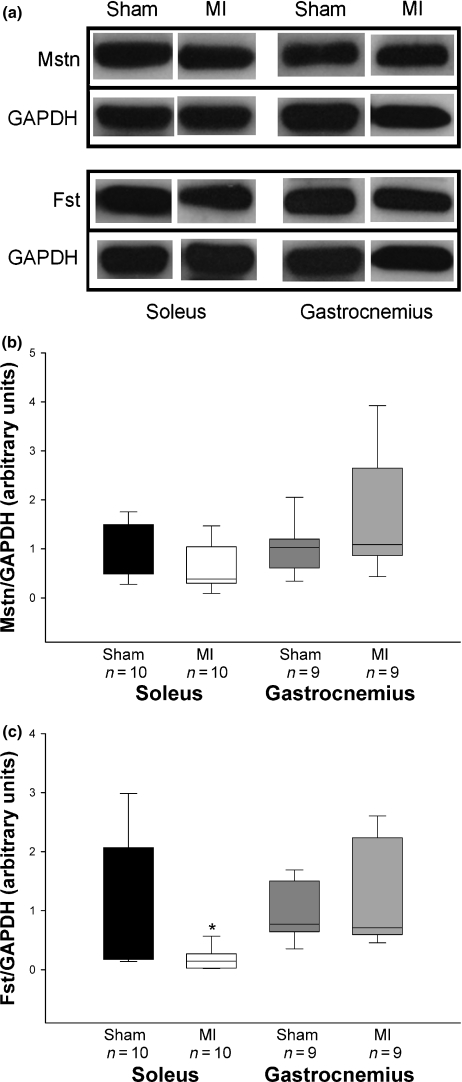
Figure 4.
(a) Representative Western blots of myostatin, follistatin, and GAPDH. Quantification of myostatin (b) and follistatin (c) protein levels in soleus and gastrocnemius muscles. MI: rats with myocardial infarction-induced heart failure. Data are expressed as median (lower quartile – upper quartile); Mann–Whitney test; *P= 0.03.

