Figure 3.
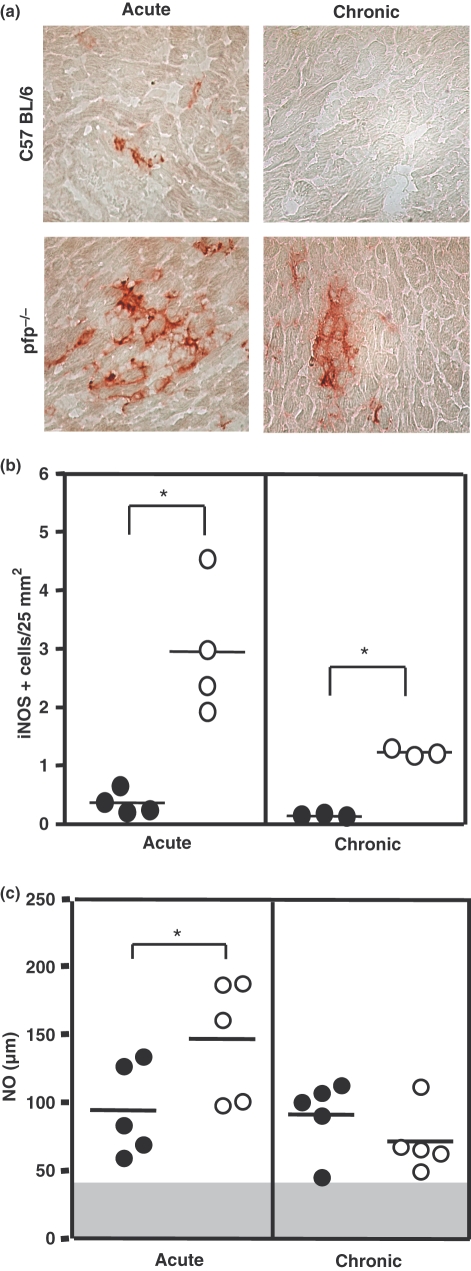
Immunohistochemistry analyses of inducible nitric oxide synthase (iNOS)-expressing cells in the heart tissue and NO levels in serum of Trypanosoma cruzi-infected mice. (a) Representative pictures of iNOS+ cells in heart tissue sections of T. cruzi-infected C57BL/6 and pfp−/− mice at 50 (acute) and 150 (chronic) days postinfection. (b) The number of iNOS+ cells in 25 mm2 of area of cardiac tissue sections obtained from C57BL/6 (black circle) or pfp−/− (white circle) mice at acute (50 days postinfection) and chronic (150 days postinfection) phases are shown. Each circle represents an individual mouse. The data represent two independent experiments. (c) NO2− plus NO3− levels were determined in the serum during the acute and chronic phases of infection. The graphs show means of five animals per group. The data are representative of two independent experiments. The grey area represents the mean plus twofold SD of non-infected mice for NO levels in serum. *P< 0.05 for comparison of pfp−/− (white circle) vs. C57BL/6 (black circle) infected mice at the same time point.

