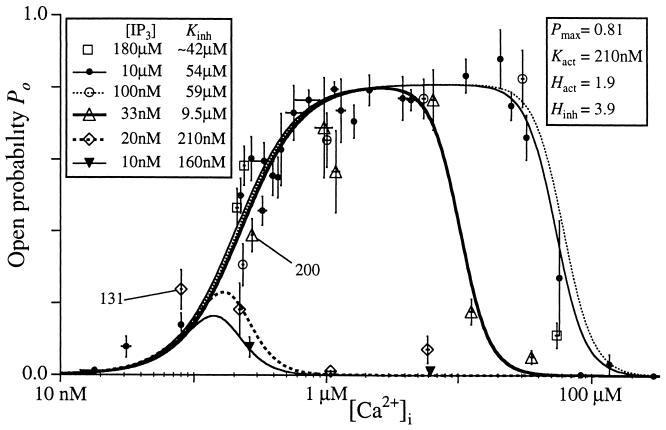
Figure 2.
IP3-concentration dependence of the [Ca2+]i sensitivity of the IP3R. Different symbols denote data for various IP3 concentrations as tabulated. Data points for 10 μM IP3 were combined from experiments using various bath solutions with the same pipette [Ca2+]. Data points for other concentrations of IP3 were obtained in bath solutions containing 220 nM Ca2+ and no ATP. The curves are Hill equation fits using Eq. 1, with Kinh varying with IP3 concentration with values as listed in the graph, whereas Pmax, Kact, Hact, and Hinh remained independent of IP3 concentration, with the values tabulated in the graph. Numerical labels indicate calculated concentrations (in μM) of free Ca2+ chelator BAPTA present in pipette solutions used for the corresponding data points.

