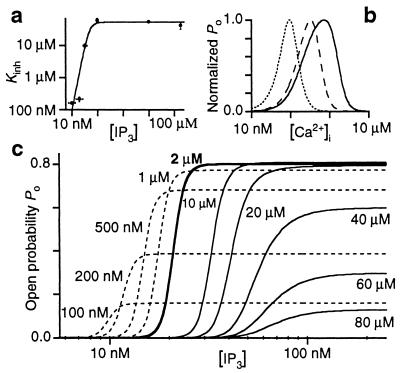
Figure 3.
(a) Dependence on IP3 concentration of Kinh as derived from Fig. 2. The curve is a simple Hill equation fit. (b) Bell-shaped normalized Po-vs.-[Ca2+]i curves calculated by using Eqs. 1 and 2 for various low concentrations of IP3 (dotted curve, 10 nM IP3 with maximum Po of 0.09; dashed curve, 15 nM IP3 with maximum Po of 0.49; and solid curve, 20 nM IP3 with maximum Po of 0.71). (c) Theoretical Po (calculated by using the model) vs. IP3 concentration at various [Ca2+]i, as labeled. Dashed curves, [Ca2+]i ≤ 1 μM; thin solid curves, [Ca2+]i ≥ 10 μM.

