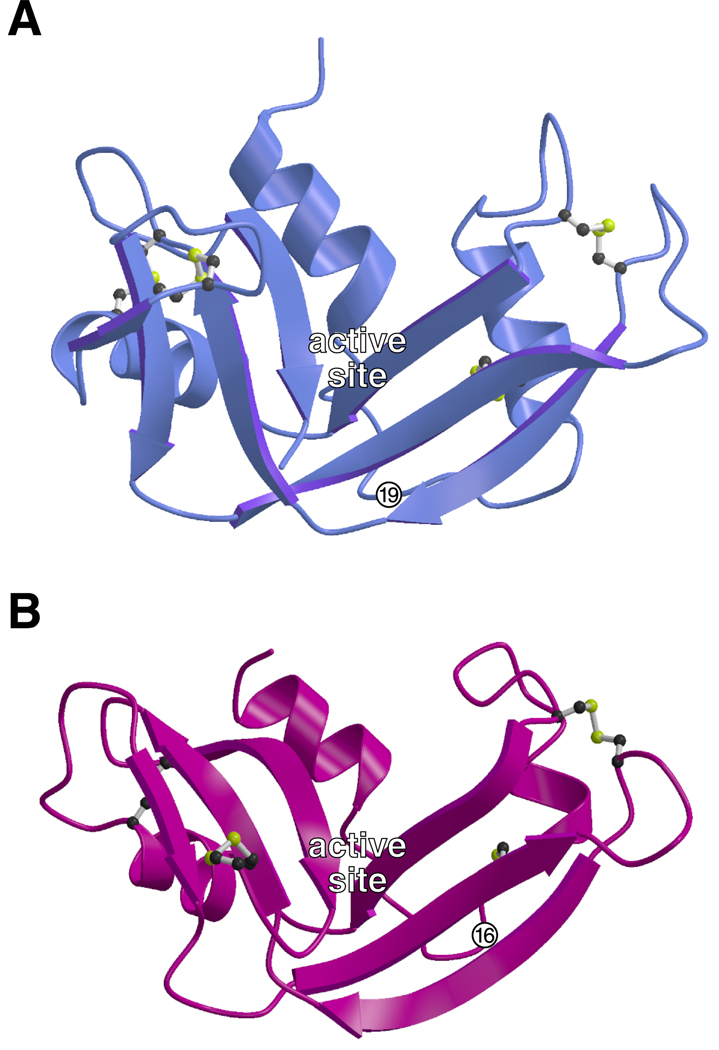
Fig. 1.
Three-dimensional structure of ribonuclease A and Onconase®. Ribbon diagrams of (A) RNase A and (B) ONC were created using the atomic coordinates derived by x-ray diffraction analysis (Wlodawer, 1985; Mosimann et al., 1994) and the program MOLSCRIPT (Kraulis, 1991). The location of the active site clefts and residues 19 (RNase A) and 16 (ONC), which were replaced with cysteine for labeling experiments, are indicated.

