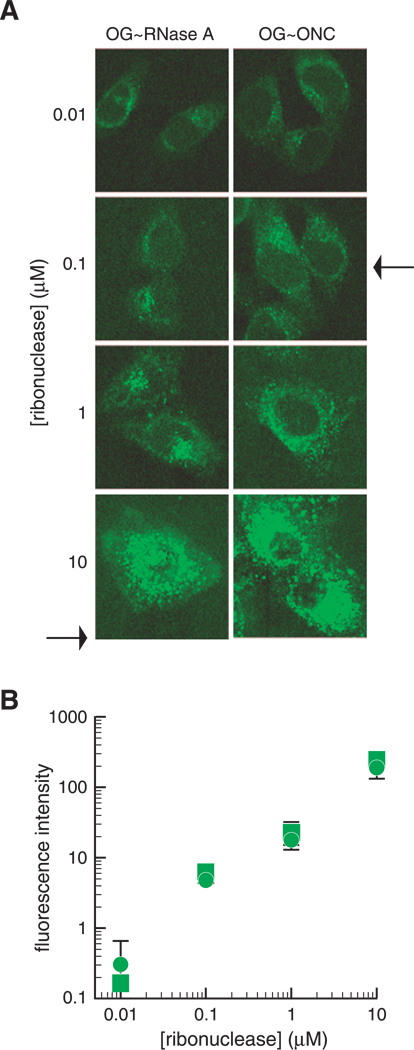
Fig. 6.
Dose-dependent internalization of OG–RNase A and OG–ONC. (A) HeLa cells were grown on coverslips in the wells of a 6-well plate, incubated with 30% labeled OG–RNase A or OG–ONC (0.01, 0.1, 1, and 10 µM), washed, and fixed as described for Fig. 5. The arrows correspond to the IC50 values for G88R RNase A and ONC (Table II). (B) HeLa cells were pulsed with OG–RNase A (circles) or OG–ONC (squares) as described for panel A, except that cells were treated with trypsin before fixation. Fluorescence was quantitated using a FACScan flow cytometer. Each data point represents the mean (±SE) of the fluorescence from 10,000 cells in two separate experiments.

