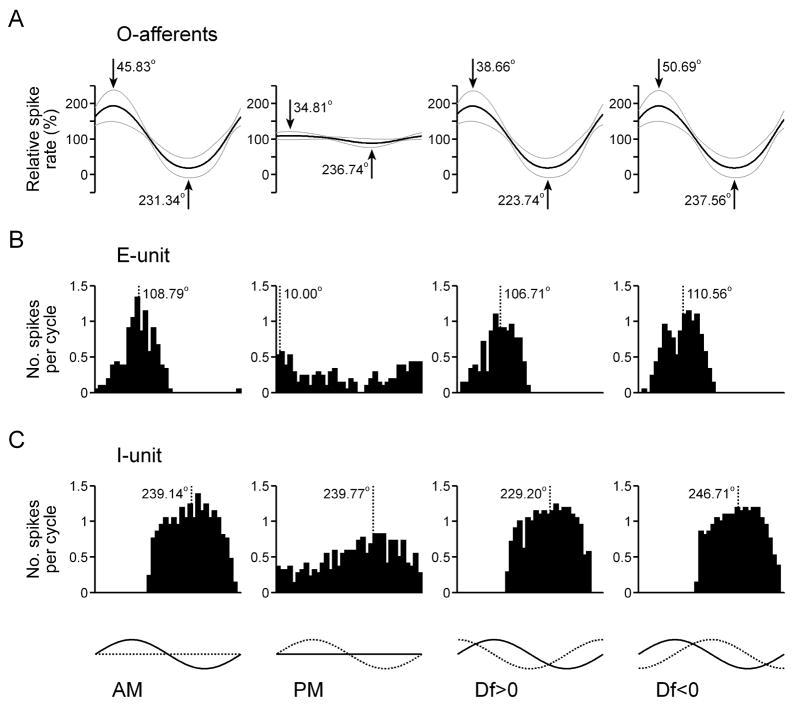
Fig. 10.
Responses to sinusoidal AM and PM in the amplitude-coding pathway. (A) O-afferent spike times (mean is represented by the black line, mean ± st. dev. is represented by grey lines, n = 21 units). The timing of the maximum and minimum spike rate is shown in degrees relative to the modulation cycle. (B,C) Histograms of spike times relative to the modulation cycle for an ELL E-unit (B) and ELL I-unit (C). The dashed line shows the average vector angle of the spikes relative to the modulation cycle. At the bottom of the figure, the amplitude of each stimulus is represented by a solid line and the phase of each stimulus is represented by a dashed line.

