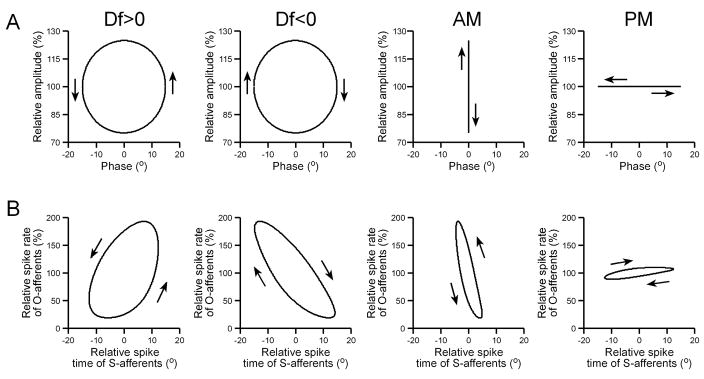
Fig. 11.
Primary afferent representations of sinusoidal stimulus modulations. (A) Sinusoidal stimulus modulations, plotted as Lissajous graphs of relative amplitude vs. phase. (B) Primary afferent representations of the stimuli in (A), plotted as Lissajous graphs of the mean relative spike rate of O-afferents (n = 34) vs. the mean relative spike time of S-afferents (n = 21).

