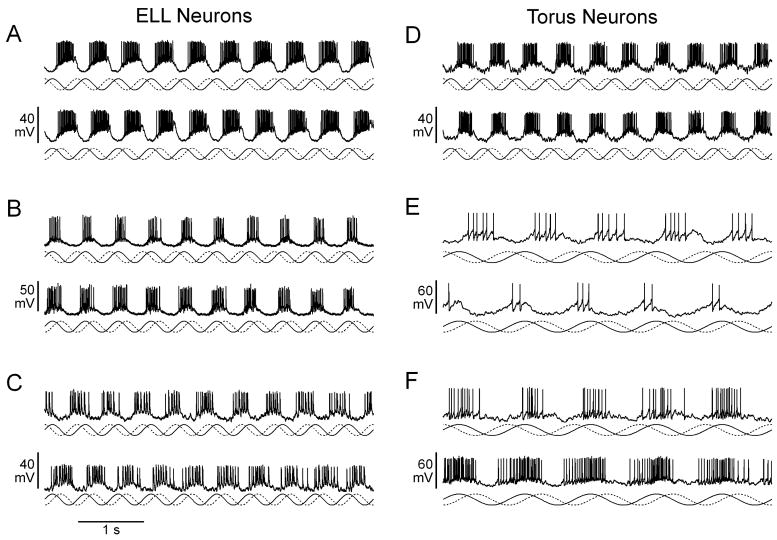
Fig. 5.
Responses of ELL (A–C) and torus neurons (D–F) to jamming stimuli. In each case, an intracellular recording during Df>0 stimulation (top trace) and Df<0 stimulation (bottom trace) is shown. Below each trace, the amplitude of the signal is represented by a solid line and the phase of the signal is represented by a dashed line. (A) Same neuron as Fig. 3(A). (B) Same neuron as Fig. 3(B). (C) Same neuron as Fig. 3(D). (D) Same neuron as Fig. 4(E). (E) Same neuron as Fig. 4(C). (F) Same neuron as Fig. 4(D).

