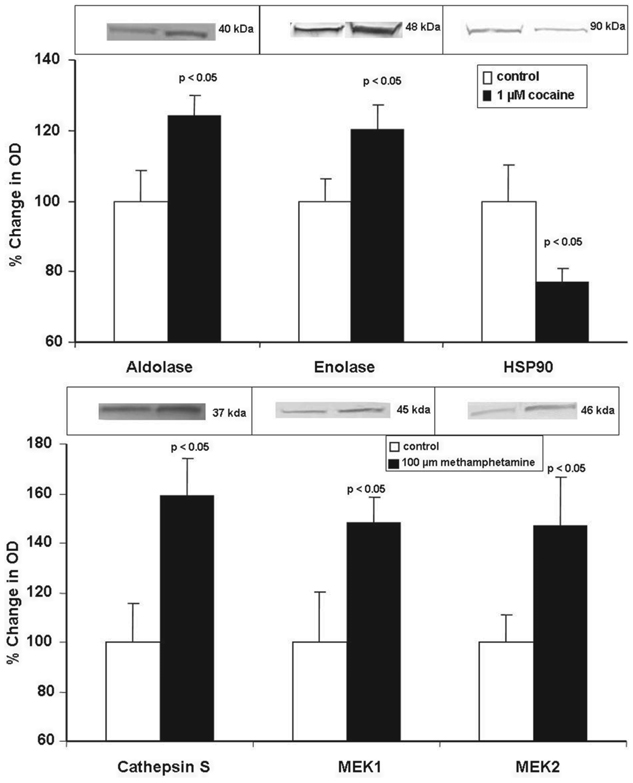
Figure 3.
Western blot analyses of selected, differentially expressed proteins from mature dendritic cells treated with (A) cocaine or (B) methamphetamine. Data were normalized to protein expression levels of β-actin. The graphs show the mean ± SD of % change in OD as measured by densitometry of bands from Western blots from 4 independent experiments. Statistical significance was determined by Student’s t-test.

