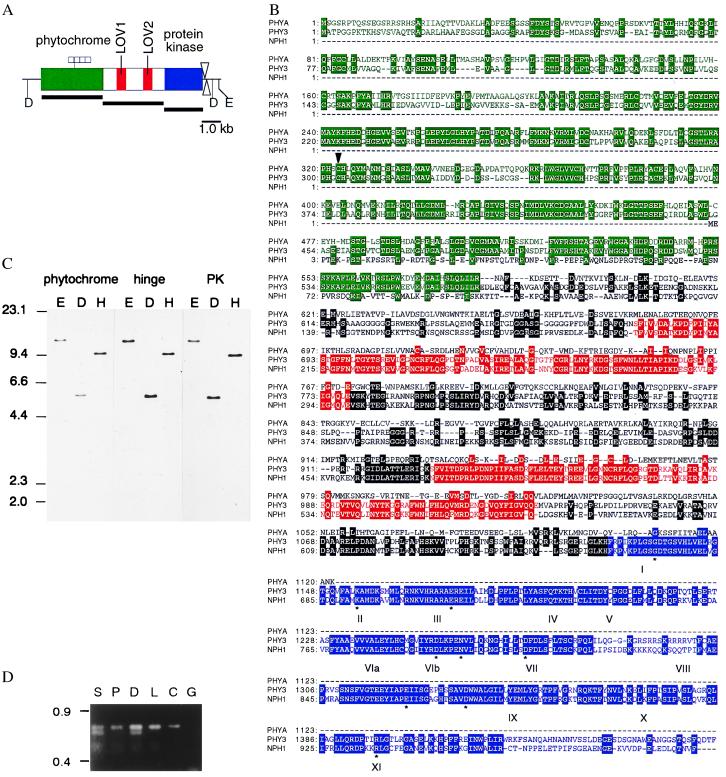
Figure 1.
Isolation and molecular characterization of the Adiantum PHY3. (A) Schematic representation of domains in the predicted Adiantum PHY3 protein. Three different domains are indicated by green, red, and blue, respectively. The positions of Poly(A) addition sites are indicated by arrowheads. The positions of the probes used in C are indicated by solid lines. E, EcoRV; D, DraI. (B) The predicted amino acid sequence of Adiantum PHY3 aligned with Arabidopsis PHYA and Arabidopsis NPH1. The alignment was constructed with genetyx version 8. The putative phytochrome chromophore binding site (Cys) is indicated by an arrowhead. The 12 conserved subdomains of the PK domain (shown in blue) are indicated by roman numerals. All amino acids conserved among Ser/Thr PKs are indicated by ∗. Residues identical to those of the Adiantum PHY3 are highlighted. Color indication is the same as for A. (C) Genomic DNA blot analysis. Blots were hybridized with phytochrome, the central hinge, or PK domain probes. Marker sizes are shown on the left in kb. E, EcoRV; D, DraI; H, HincII. (D) RT-PCR analysis. S; spores imbibed for 1 day under darkness; P, spores imbibed for 4 days under darkness and cultured for 3 days under unilateral red light (0.6 W/m2); D, newly emerged sporophytic crosier grown under darkness; L, newly emerged sporophytic crosier grown under natural conditions; C, cDNA clone; G, genomic clone. Marker sizes are shown on the left in kb.

