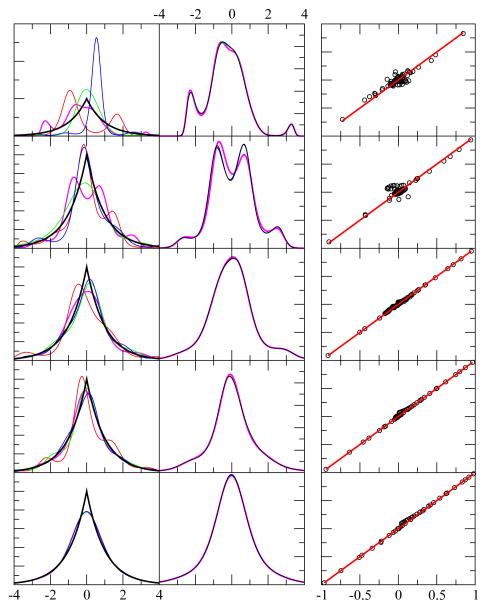
Figure 2.
Example results for test case 2. The first column shows the exact pdf (black) and four predicted pdf (red, green, blue, magenta) using independent random samples. The x-axis displays the range of the random variable in arbitrary units, while the y-axis is dimensionless. From top to bottom rows the number of random events in each sample were 64, 256, 1024, 4096 and 1048576. The second column is similar to the first, except it shows the result shown in magenta in the first column, and compares it with four additional results for the same sample — but from a different funnel diffusion run (black, red, green and blue). The third column shows 80 different level function moments calculated from the empirical data (x-axis) and from the theoretical prediction (y-axis) as defined in Eqaution 5. Perfect agreement would fall along the red line (y = x).

