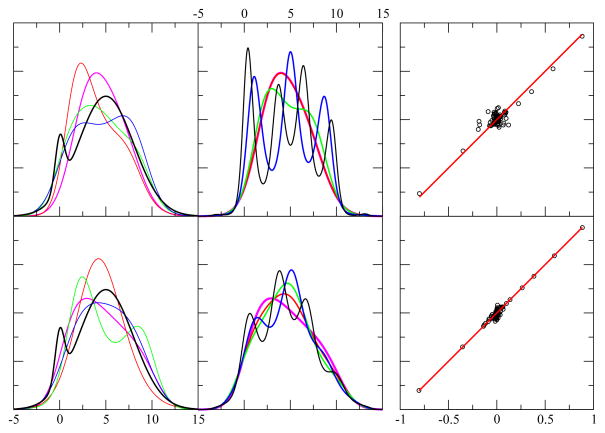
Figure 6.
Example results using smoothing on test case 4. The first column shows the exact pdf (black) and four predicted pdf (red, green, blue, magenta) using smoothing level, s = 10, (defined in Equation 16) and each case is drawn from independent random samples. The x-axis displays the range of the random variable in arbitrary units, while the y-axis is dimensionless. The top and bottom rows contain 256 and 1024 random events. The second column is similar to the first, except it shows the result shown in magenta in the first column, and compares it with four additional results for the same sample — but using different smoothing requests with s = 2, 4, 6, 8 shown as (black, blue, green, red). Note that the red curve is essentially indistinguishable from the curve shown in magenta. Of course, since the objective function changes, this implies a different funnel diffusion run as well. The third column shows 80 different level function moments calculated from the empirical data (x-axis) and from the theoretical prediction (y-axis) as defined in Equation 5. These results correspond to the s = 10 smoothing case shown in the first column by the magenta curve. Perfect agreement would fall along the red line (y = x).

