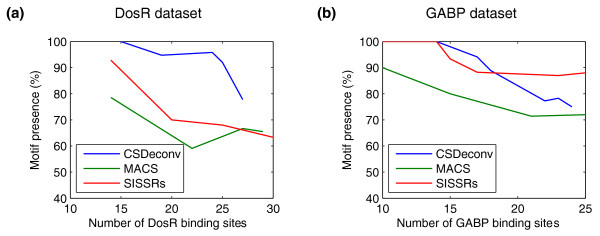
Figure 5.
Comparison of CSDeconv, MACS, and SISSRs by motif analysis. The percentage of predicted binding sites with associated motifs within 50 bp is shown as a function of the number of predicted binding sites with CSDeconv, MACS, and SISSRs for (a) DosR and (b) GABP. For MACS and SISSRs, we take the predicted binding-site location to be the peak center.

