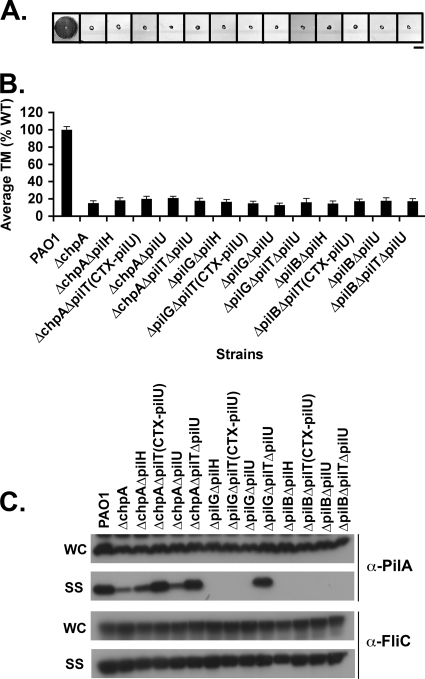
FIG. 4.
chpA, pilG, and pilB function upstream of pilH, pilT, and pilU. (A) Subsurface TM assays were performed as described in Fig. 1. Bar, 1 cm. (B) Graph depicting average TM zone diameters for the indicated strains. Shown are the means ± the SD (n = 5). The residual zone of TM in all of the mutants represents colony growth and is similar to of the ΔpilA mutant. (C) Surface structures (SS) and intracellular (WC) preparations of the indicated strains were immunoblotted with a polyclonal antibody to PilA (α-pilA) or to FliC (α-FliC), as described in Fig. 2.

