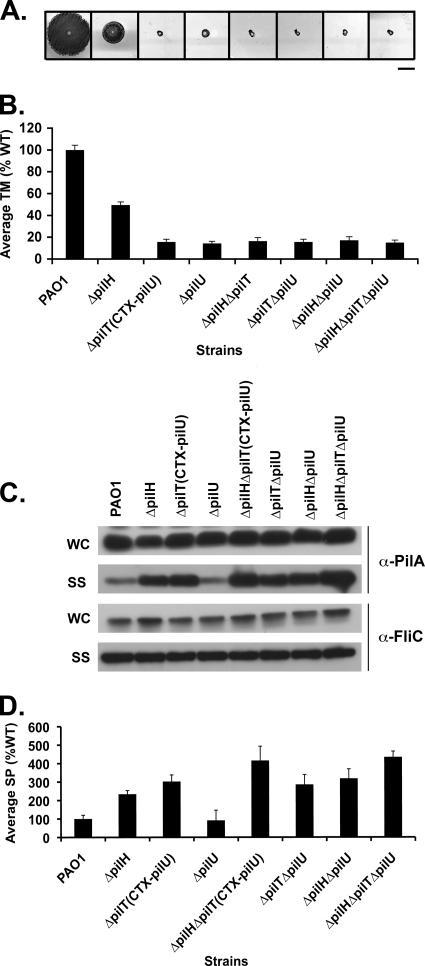
FIG. 5.
PilH enhances the function of PilT but not PilU. (A) Subsurface TM assays were performed as described in Fig. 1. Bar, 1 cm. (B) Graph depicting average TM zone diameters for the indicated strains. Shown are the means ± the SD (n = 5). The residual zone of TM in all of the mutants represents colony growth and is similar to that of the ΔpilA mutant. (C) A 1:5 dilution of surface structures (SS) and cell intracellular (WC) preparations of the indicated strains were immunoblotted with a polyclonal antibody to PilA (α-pilA) or to FliC (α-FliC), as described in Fig. 2. (D) Quantification of surface piliation levels relative to a FliC loading control. Surface piliation levels are expressed as a percentage of PAO1. Shown are the means ± the SD (n = 3).

